![]()
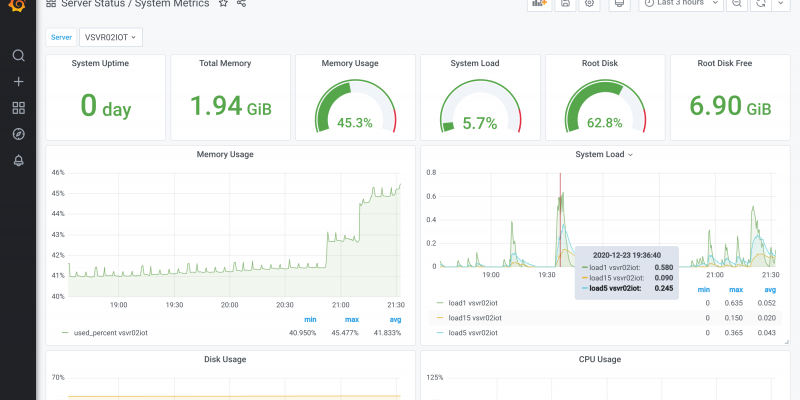
Dashboards are a great way to get at-a-glance diagnostics of a server's vital statistics. Consolidating this data from multiple servers in one place makes this server-sitting task even easier. A Linux server configured with Telegraf, InfluxDB and Grafana (a.k.a. a TIG stack) is an easy way...
Welcome to the virtual home of Phaedrus Technologies where we explore the likes of:
- Industrial Automation
- IoT
- Data Science
- Linux & Open Source
For commercial applications see:
 |
Tetranex Solutions |
|---|